Key Takeaways
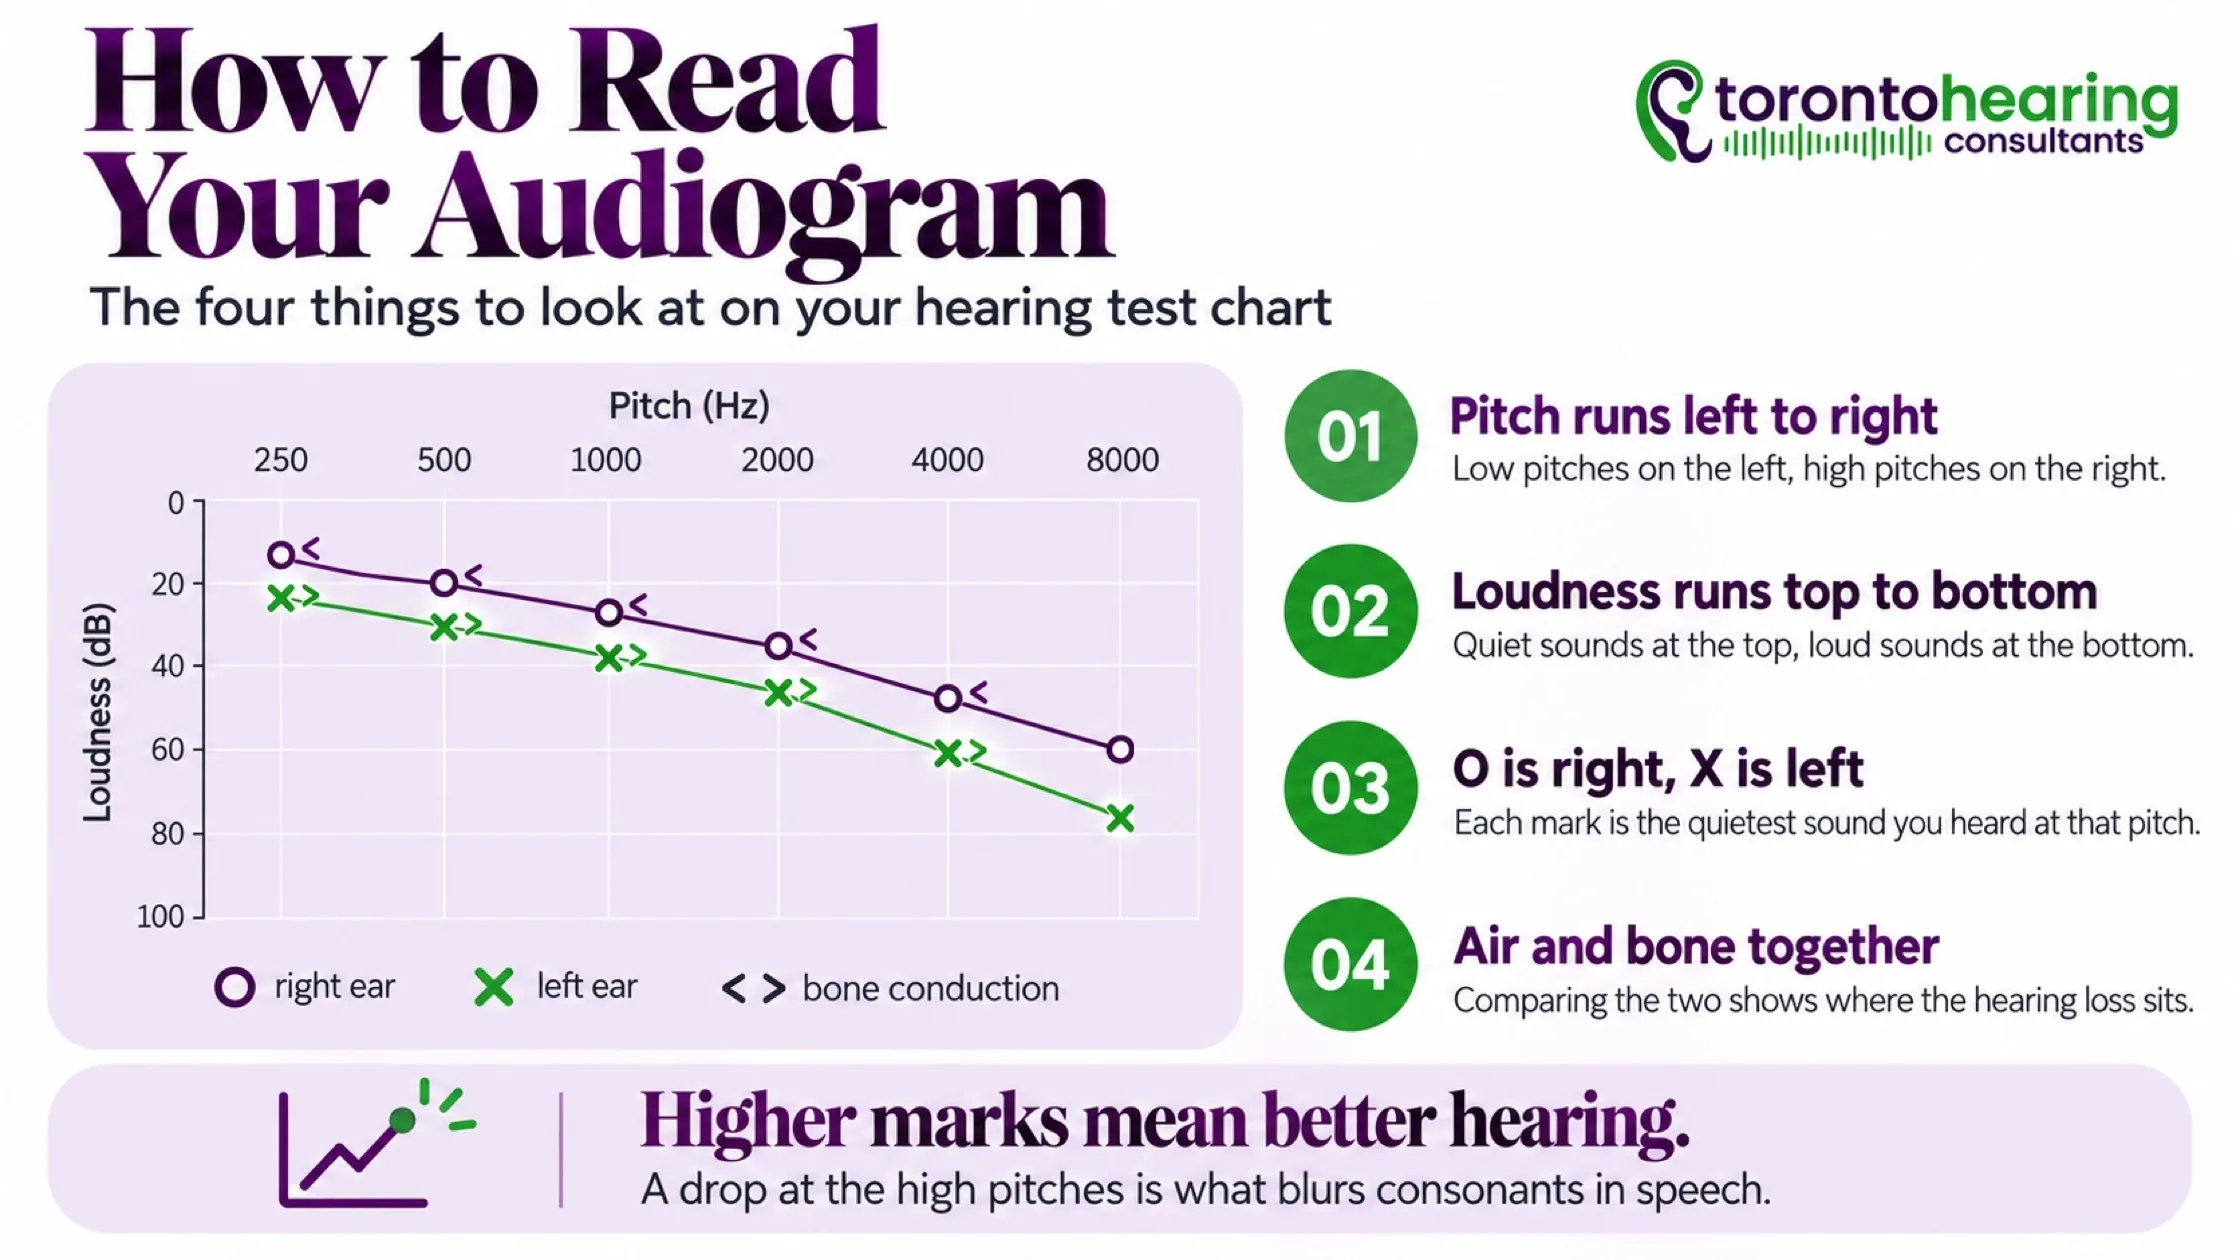
- An audiogram is a graph of your hearing test results. Pitch runs left to right, and loudness runs top to bottom, with quiet sounds at the top and loud ones at the bottom.
- The higher your marks sit on the chart, the better you hear at that pitch.
- O marks your right ear, X marks your left. Air conduction uses those symbols; bone conduction uses brackets or arrows.
- Hearing is graded in decibels hearing level, from normal through minimal, mild, moderate, moderately severe, severe, and profound.
- At Toronto Hearing Consultants, hearing thresholds of 20 dB HL or lower are considered normal. Higher thresholds may indicate hearing loss.
- The speech banana shows which conversation sounds you can hear, and hearing loss levels, from minimal to profound, describe how loud a sound must be before you hear it.
You've had your hearing tested, and now you're looking at a chart filled with circles, crosses, and lines. What do those numbers mean? Is your hearing within the normal range? And why do some of the marks sit much lower than others?
That chart is called an audiogram. It shows the softest sounds you can hear at different pitches in each ear, helping your audiologist identify hearing loss and understand which sounds may be harder for you to hear.
At Toronto Hearing Consultants, we explain your audiogram during your hearing test appointment and give you a copy to take home. Understanding the symbols, numbers, and hearing loss levels can help you make sense of your results, especially if you've been having trouble following conversations or hearing certain sounds.
What Does an Audiogram Show?
An audiogram measures two things: the pitch of a sound and how loud it needs to be before you can hear it. Together, these measurements show which sounds you hear easily and which ones you may be missing.
Understanding Pitch and Frequency
Across the top of the chart, you'll see numbers ranging from around 250 to 8,000 hertz (Hz). These measure frequency, or how high or low a sound is.
Lower pitches appear on the left side of the chart. Think of a deep voice or the low hum of an appliance. Higher pitches appear on the right, where you'll find sounds such as birds chirping and consonants like s, f, th, and k.
These higher-pitched consonants are particularly important for understanding speech. You might hear someone talking but struggle to distinguish similar-sounding words because you're missing parts of what they're saying.
Understanding Loudness and Decibels
Down the side of the chart, you'll see numbers measured in decibels hearing level (dB HL).
Here's where an audiogram can be confusing at first: the quieter sounds are at the top, and the louder sounds are at the bottom.
Each mark represents the softest sound you could hear at a particular pitch. Audiologists call this your hearing threshold.
For example, if your threshold at 4,000 Hz is 60 dB HL, that means a sound at that pitch had to reach approximately 60 dB HL before you could detect it. Softer sounds at the same frequency may go unnoticed.
The higher your marks appear on the chart, the softer the sounds you were able to hear. If your marks drop lower at certain pitches, it means those sounds needed to be louder before you could hear them.
What Do the Symbols on an Audiogram Mean?
The circles, crosses, and brackets on your audiogram aren't random. They show which ear was tested and how the sound was delivered.
| Symbol | What it records |
|---|---|
| O | Right ear, air conduction |
| X | Left ear, air conduction |
| △ | Right ear, air conduction, masked |
| □ | Left ear, air conduction, masked |
| < or [ | Right ear, bone conduction (< unmasked, [ masked) |
| > or ] | Left ear, bone conduction (> unmasked, ] masked) |
You'll usually see red circles (O) for the right ear and blue crosses (X) for the left ear. These are the results of air conduction testing, where sounds travel through your ear canal, middle ear, and inner ear.
Other symbols represent bone conduction testing, which uses a small device placed behind your ear to send vibrations directly to the inner ear.
Why Are Air and Bone Conduction Both Tested?
Imagine your hearing test shows that you have difficulty hearing certain sounds. Your audiologist needs to determine whether the problem involves sound travelling through the outer or middle ear, or whether it's related to the inner ear or hearing nerve.
That's why both tests are important.
- Sensorineural hearing loss: Air and bone conduction results are both reduced and sit close together on the chart. This suggests the hearing loss involves the inner ear or hearing nerve.
- Conductive hearing loss: Air conduction results are poorer than bone conduction results. This difference, called an air-bone gap, may indicate something affecting sound as it travels through the outer or middle ear, such as impacted earwax or middle-ear fluid.
- Mixed hearing loss: Both air and bone conduction results are reduced, but there's also a gap between them. This indicates a combination of conductive and sensorineural hearing loss.
You may also notice different symbols when your audiologist uses masking. This involves playing a soft rushing noise into one ear while testing the other, preventing the better-hearing ear from responding to sounds intended for the ear being tested.
At Toronto Hearing Consultants, audiologist Natasha Manji (M.Cl.Sc., Reg. CASLPO) reviews these results with you and explains what they reveal about your hearing.
What Do Mild, Moderate and Severe Hearing Loss Mean in Decibels?
You might see words like mild, moderate or severe written beside your hearing test results. These describe how loud sounds need to be before you can hear them.
For example, someone with mild hearing loss may hear conversations clearly in a quiet room but struggle when several people are talking at once. With moderate hearing loss, ordinary speech may become difficult to follow, even when there's little background noise.
Here are the following ranges to describe hearing loss:
| Degree | Range (dB HL) |
|---|---|
| Normal | 0 to 20 |
| Mild | 25-41 |
| Moderate | 41-55 |
| Moderately severe | 55-65 |
| Severe | 70-85 |
| Profound | 90+ |
The degree of hearing loss depends on how much louder the sounds need to be and which pitches are affected. Your audiologist will explain what the results mean and whether they could be affecting your ability to follow conversations or hear certain sounds.
You may also see a number called your pure-tone average (PTA). This is calculated using your hearing thresholds at 500, 1,000, and 2,000 Hz, frequencies that are important for understanding speech.
However, the average doesn't tell you everything. You could have a normal PTA and still have difficulty hearing higher-pitched sounds, including consonants that help you distinguish one word from another.
Children can also be affected by small changes in hearing, particularly when learning to speak, following instructions, or listening in a noisy classroom. Even mild hearing loss can make it harder to hear certain speech sounds, which may affect communication and learning. A kids' hearing test can help identify these changes from age 3.5.
What Is the Speech Banana?
Have you ever heard someone speaking clearly enough to know they're talking, but couldn't quite make out what they said? Your audiogram may help explain why.
Some audiograms include a shaded area shaped like a banana. This is called the speech banana, and it shows where common speech sounds fall according to their pitch and loudness.
Vowels, such as a, e, and o, generally fall within the lower and middle frequencies. Consonants like s, f, and th are higher-pitched and often quieter.
If your hearing thresholds fall below certain speech sounds on the chart, those sounds may be too quiet for you to hear at a normal speaking volume.
This is especially common with high-frequency hearing loss. You may hear the louder vowel sounds but miss quieter consonants, making words sound unclear or incomplete.
How to Read a Sample Audiogram
Let's look at an example of someone who hears reasonably well in quiet settings but struggles to follow conversations in restaurants or other noisy places.
Their audiogram shows normal hearing at lower pitches, followed by a noticeable drop at higher frequencies.
Here's what the results look like:
- 250 to 2,000 Hz: Hearing thresholds sit between 10 and 15 dB HL, within the normal range.
- 4,000 Hz: The threshold drops to 45 dB HL, indicating moderate hearing loss at this frequency.
- 8,000 Hz: The threshold reaches 55 dB HL, also within the moderate range.
- Bone conduction: The results closely match the air conduction thresholds, suggesting sensorineural hearing loss.
- Pure tone average: The average across 500, 1,000 and 2,000 Hz is approximately 13 dB HL, which falls within the normal range.
So what does this mean for everyday hearing?
This person may hear the deeper parts of someone's voice without much difficulty. However, higher-pitched consonants such as s, f, and th may be harder to hear, particularly when there's background noise.
Their pure-tone average looks normal because it doesn't include the higher frequencies where hearing loss is present. This is why audiologists examine the entire audiogram rather than relying on one number.
High-frequency hearing loss is commonly associated with ageing and long-term exposure to loud sounds. Your audiologist will consider your hearing history, speech test results and the difficulties you've noticed when explaining what your audiogram means.
At Toronto Hearing Consultants, hearing assessments take approximately 60 minutes, and your audiologist reviews your results with you during the appointment.
Here is one example; read step by step, the same way your audiologist would review it with you. It is an illustration, not a patient's result.
Picture a right ear, marked with red O symbols. Its results sit at 10 to 15 dB HL from 250 to 2,000 Hz, then drop to 45 dB HL at 4,000 Hz and 55 dB HL at 8,000 Hz. The bone conduction marks (<) sit right alongside the O marks.
- Low and middle pitches: results of 10 to 15 dB HL fall in the normal range, so vowels and the body of a voice come through clearly.
- High pitches: 45 dB HL at 4,000 Hz and 55 dB HL at 8,000 Hz both fall in the moderate range, so soft consonants such as s, f, and th may be harder to catch.
- Air and bone together: the bone conduction marks sit with the air conduction marks, with no gap between them, which points to a sensorineural hearing loss.
- Pure tone average: the average of the 500, 1,000 and 2,000 Hz results is about 13 dB HL, in the normal range. This is why the average is always read with the full chart, since it does not show the change in the high pitches.
- Speech banana: the high-pitch marks dip into the right-hand end of the banana, the pattern behind hearing that someone is talking while missing some of the words.
A drop in the high pitches like this is a common pattern as hearing changes with age, and it can also follow long-term exposure to loud sound, including earbuds and headphones played at high volume. Your audiologist will talk through how it may affect the moments that matter to you, from work meetings to family dinners and watching TV.
Seeing your own results laid out this way can bring clarity and peace of mind. A hearing test at either of our clinics takes about 60 minutes, and your audiologist reviews your audiogram with you before you leave.
Common Audiogram Patterns
Most audiograms follow one of a few familiar shapes. Your audiologist reads yours as a whole, but these are the patterns you are most likely to see:
| Pattern | What it looks like | What it can point to |
|---|---|---|
| High-pitch slope | Marks start near the top on the left and drop toward the right | Common as hearing changes with age |
| Noise notch | A dip in the high pitches, often between 4,000 and 6,000 Hz, with slightly better hearing just above it | Often linked to long-term exposure to loud sound, and may come with ringing in the ears |
| Flat loss | Marks sit at a similar level across all pitches | Several possible causes, including middle-ear fluid; the air and bone results help show which |
| Cookie-bite | A dip in the middle pitches, with better hearing at the low and high ends | Often runs in families |
| Reverse slope | Low pitches are affected more than high pitches | Less common, and may be linked to inner-ear conditions such as Ménière's disease, which may need a physician's assessment |
Other Results on Your Hearing Test Report
Your audiogram isn't the only information you'll receive during a hearing assessment. Your report may also include measurements showing how well you understand speech and how your middle ear is functioning.
Speech Reception Threshold and Word Recognition
- Your speech reception threshold (SRT) measures the quietest level at which you can correctly repeat familiar two-syllable words. This result is usually close to your pure tone average.
- Your word recognition score measures how accurately you repeat words presented at an appropriate listening level.
For example, two people may have similar hearing thresholds but very different word recognition scores. One person may understand most words once they're loud enough, while another may continue to miss parts of speech even when the volume increases.
These results help your audiologist understand whether making sounds louder is likely to improve speech clarity.
What Does a Tympanogram Show?
A tympanogram measures how your eardrum responds to changes in air pressure. It helps identify problems involving the middle ear that may affect hearing.
You may see one of three common results:
- Type A: The eardrum moves within the expected range, generally indicating normal middle-ear function.
- Type B: The graph appears relatively flat. Depending on other measurements, this may suggest fluid behind the eardrum, a perforation, or another middle-ear issue.
- Type C: The results show negative pressure in the middle ear, which can occur when the Eustachian tube isn't working normally, sometimes during a cold or with allergies.
Your audiologist reviews these measurements alongside your hearing thresholds to understand whether a middle-ear problem may be contributing to your symptoms.
Can You Have Hearing Problems With a Normal Audiogram?
Yes. You can have hearing thresholds within the normal range and still struggle to understand conversations, particularly in restaurants, busy offices, or other noisy environments.
A standard audiogram measures the softest sounds you can hear at different pitches. It doesn't tell your audiologist everything about how you understand speech when several sounds are competing for your attention.
That's why a diagnostic assessment may also include speech-in-noise testing, which measures how well you understand words or sentences with background noise present.
At Toronto Hearing Consultants, speech-in-noise testing is included in diagnostic hearing appointments.
Even when your hearing results are normal, keeping a copy of your audiogram gives you something to compare against future tests. We generally recommend retesting every three years when hearing is normal and annually when hearing loss has been identified, although your audiologist may recommend a different schedule based on your needs.
What Happens After Your Audiogram?
Once your hearing test is complete, your audiologist will review the results with you and explain whether any changes were found during the hearing test.
What happens next depends on your hearing and whether anything needs further investigation.
If your results suggest a blockage from earwax or a problem affecting the middle ear, your audiologist may recommend wax removal or refer you to a physician for further assessment.
If you have sensorineural hearing loss that's affecting your ability to follow conversations, hearing aids may be worth considering. As an independent clinic, Toronto Hearing Consultants works with major hearing aid manufacturers, and our hearing aid packages include three years of ongoing clinical care.
If your hearing thresholds are normal but you're still having difficulty understanding speech, your audiologist can discuss additional testing to investigate the problem.
Some results require more urgent attention. Sudden hearing loss, particularly when it affects one ear, should be assessed urgently by a medical professional rather than waiting for a routine hearing appointment.
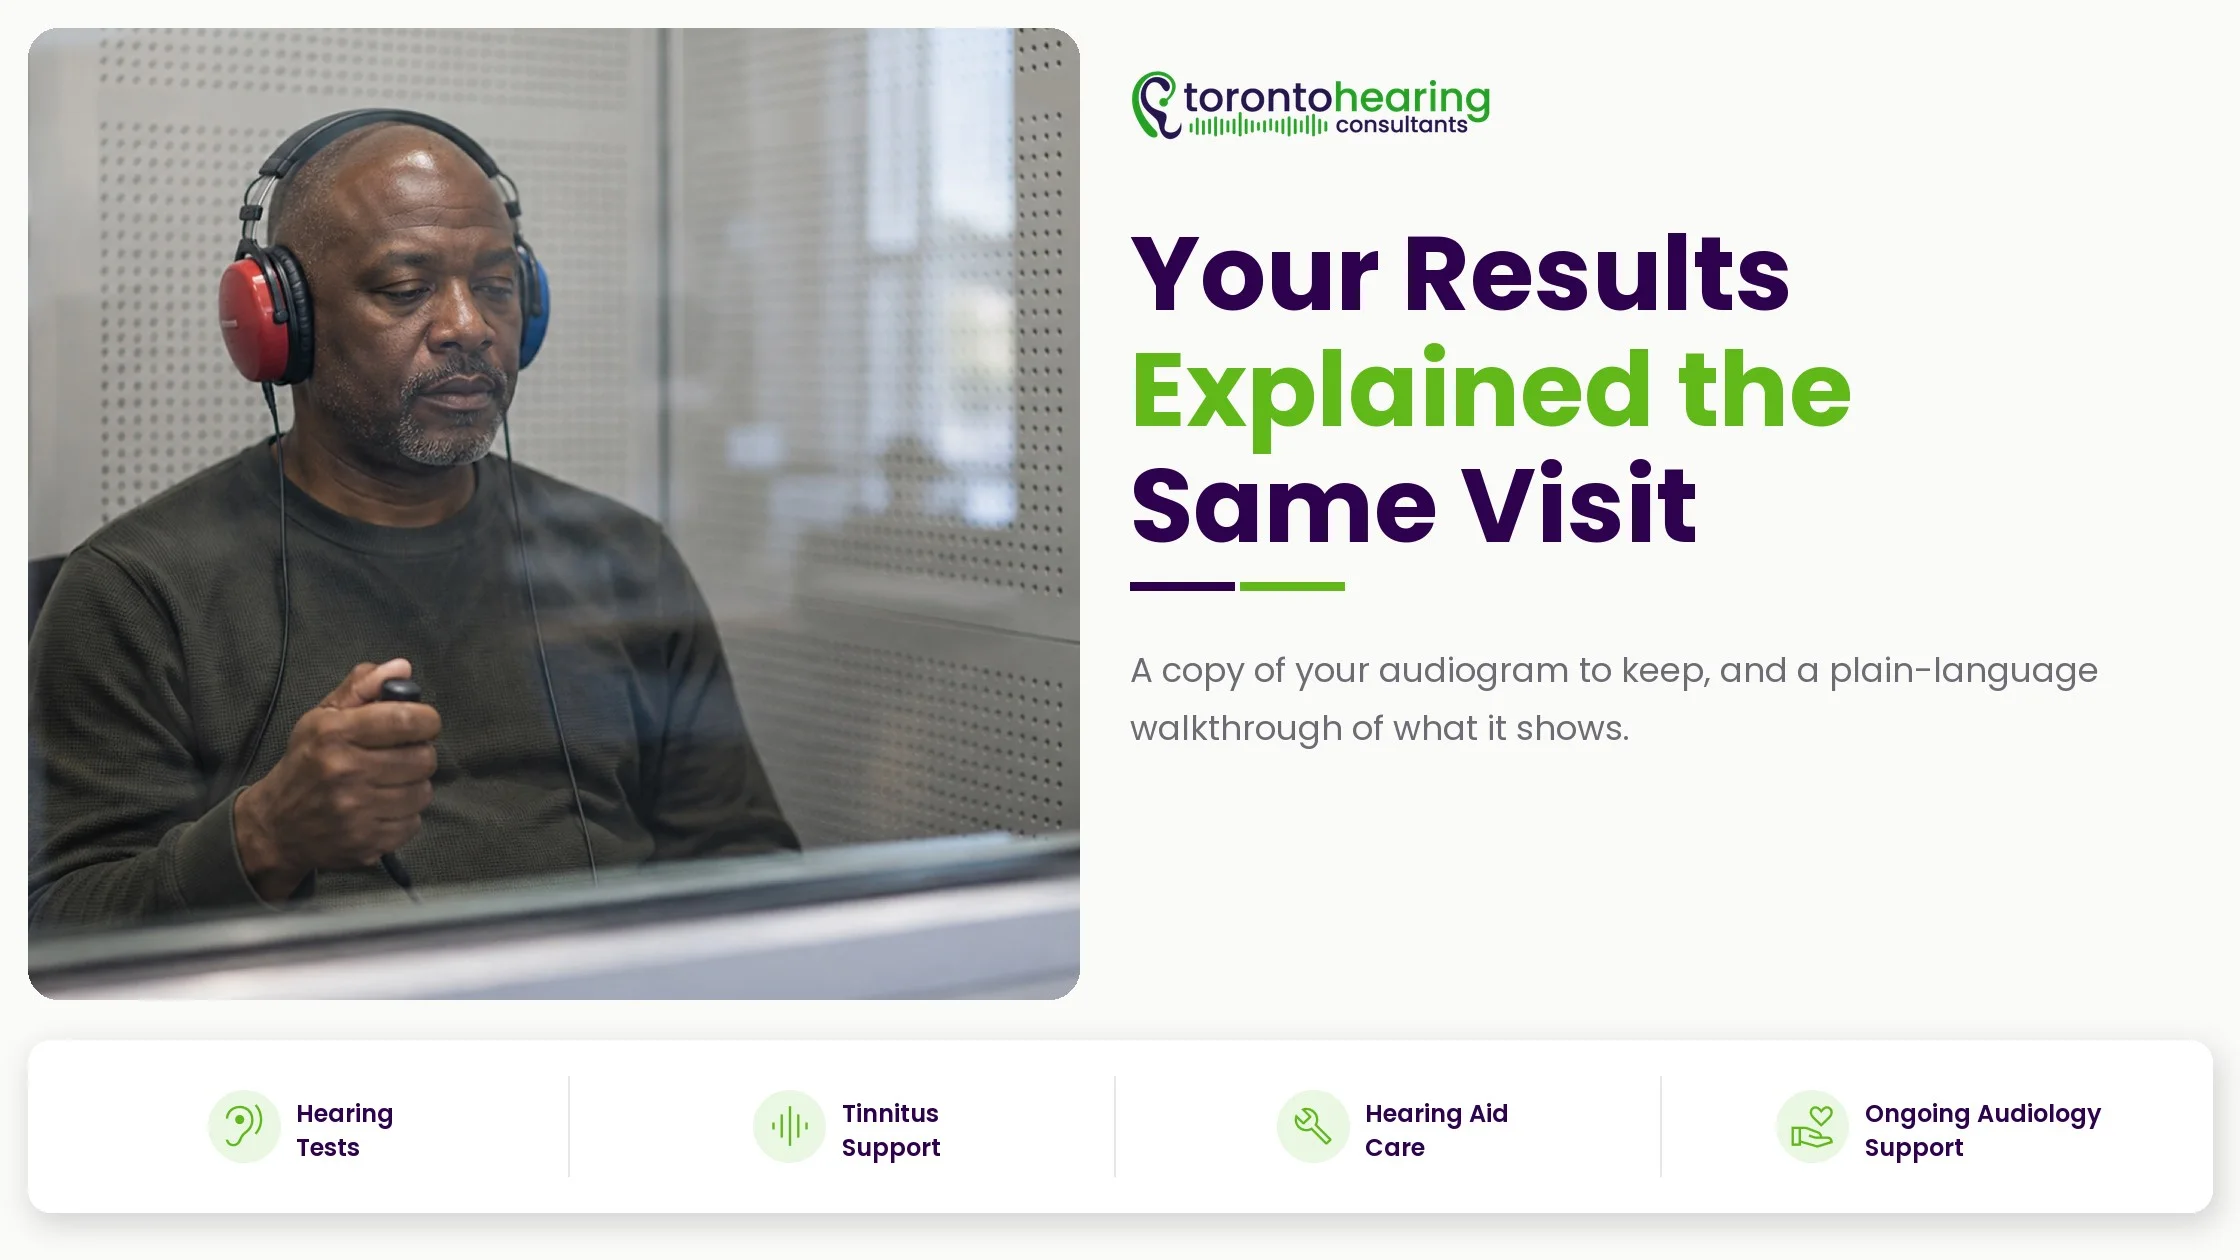
You'll receive a copy of your audiogram to keep. It can be used to compare future hearing tests and may also be required when applying for hearing aid funding through Ontario's Assistive Devices Program.
Already have an audiogram from another clinic? Bring it to your appointment. We can review the results with you and discuss whether hearing aids or further assessment may be appropriate.
Questions to Ask Your Audiologist About Your Audiogram
You don't need to understand every number or symbol on your audiogram before leaving your appointment. Your audiologist is there to explain what the results mean and answer your questions.
Some useful questions to ask include:
- Which sounds am I having the most difficulty hearing?
- Is my hearing the same in both ears?
- Could my hearing loss explain why conversations are harder to follow?
- Would hearing aids help with the difficulties I've been experiencing?
- How often should I have my hearing checked?
At Toronto Hearing Consultants, we take the time to review your results and discuss your concerns. As an independent clinic, we can also explain hearing aid options from different manufacturers if your assessment shows that amplification may help.
Understand Your Hearing Test Results With Toronto Hearing Consultants
If you've noticed changes in your hearing or have an audiogram you don't fully understand, our audiologists can help explain what your results mean.
Toronto Hearing Consultants has two independent, audiologist-led clinics in Toronto:
- Bloor West Village: 2368 Bloor St W, (416) 760-7999
- The Annex: 980 Bathurst St, (416) 516-0999
Both locations are accessible by public transit, with parking nearby. Evening appointments are also available on request.
Your assessment is performed by a registered audiologist, and your results are explained during your visit. You'll receive a copy of your audiogram and have time to discuss any questions about your hearing.
No referral is required. Contact either clinic to arrange your hearing assessment.
Frequently Asked Questions
How Do I Read My Hearing Test Results?
Start by looking at the two axes. The numbers across the top show pitch, from low sounds on the left to high sounds on the right. The numbers down the side show loudness, with softer sounds at the top. Each mark represents the quietest sound you could hear at that pitch. Circles usually represent your right ear, while crosses represent your left.
What Does My Audiogram Mean?
Your audiogram shows how well each ear hears different pitches and whether hearing loss is present. It can also help your audiologist identify whether the problem involves the outer or middle ear, the inner ear, or both. Your results are interpreted alongside speech testing and other measurements.
What Is Considered Normal Hearing on an Audiogram?
An audiogram shows the softest sounds you can hear at different pitches, measured in decibels hearing level (dB HL). Results of 20 dB HL or lower are considered normal, while higher results may indicate hearing loss at certain pitches. Your audiologist will explain your results, how they may affect your hearing, and whether any follow-up is needed.
What Does the Speech Banana Show?
The speech banana shows where common speech sounds appear on an audiogram. It helps explain why you may hear someone talking but struggle to understand certain words, especially when higher-pitched consonants are difficult to hear.
Can I Get a Copy of My Audiogram?
Yes. Toronto Hearing Consultants provides a copy of your audiogram after your assessment. Keep it with your health records so future hearing tests can be compared with your previous results. If you're applying for hearing aid funding through Ontario's Assistive Devices Program, your audiogram may also be needed.
How Often Should I Get a Hearing Test?
Every adult benefits from a baseline hearing test. If your hearing is in the normal range, a retest every three years keeps that baseline current. Once hearing loss is found, an annual test lets your audiologist track changes and adjust your care, including any hearing aid settings. If you notice a change sooner, such as turning up the TV or asking people to repeat themselves, you can book before your next scheduled test.
Do I Need Hearing Aids Based on My Audiogram?
No, not on its own. Your audiogram is one part of the decision. Your audiologist also looks at your speech-in-noise results and the situations where listening takes the most effort, such as restaurants, work meetings, or family dinners. If wax or the middle ear is involved, other steps come first. When hearing aids are appropriate, we work with all major brands, and Ontario's Assistive Devices Program contributes up to $500 per ear toward eligible hearing aids.